July Market Update: What the First Half of 2026 Teaches Investors About the Road Ahead
July Market Update: What the First Half of 2026 Teaches Investors About the Road Ahead

Wyatt Lewis | Financial Advisor
July 8, 2026
The first half of 2026 was full of major events for investors. These included the war in Iran, oil prices pushing inflation to multi-year highs, and ongoing questions about artificial intelligence (AI). Despite all of this, markets climbed to new all-time highs, company profits grew at a strong pace, and many types of investments performed well. The first six months served as a reminder that staying invested and keeping a long-term view is one of the most important things an investor can do.
The current business cycle, which is the period of economic growth since the last recession, is now in its seventh year. Concerns about inflation, interest rates, and high stock prices have come and gone repeatedly. Navigating these challenges is simply part of investing, and history shows that investors who stay the course tend to be rewarded over time.
Key market and economic highlights from the first half of 20261
• The S&P 500, Nasdaq, and Dow Jones Industrial Average have returned 9.6%, 12.8%, and 8.9% year-to-date through the end of June, respectively. The second quarter was historically strong with the S&P 500 returning 14.9%, the Nasdaq 21.4%, and the Dow 12.9%.
• The Bloomberg U.S. Aggregate Bond Index has risen 0.6% year-to-date. The 10-year Treasury yield ended the second quarter at 4.47%, rising from 4.17% at the start of the year.
• Developed market international stocks (MSCI EAFE) have gained 7.7% and emerging market stocks (MSCI EM) have returned 22.7% year-to-date, both in U.S. dollar terms.
• The Bloomberg Commodities Index has risen 12.3% year-to-date. This was due to a strong first quarter which experienced a gain of 23.3%, versus a decline of 8.9% in the second quarter.
• Brent crude peaked just under $120 per barrel in May before closing the quarter at $73 per barrel.
• Gold prices fell to $4,007 per ounce while Bitcoin declined to a recent low of $58,633.
• Headline CPI rose 4.2% year-over-year in May, driven largely by energy prices. Core CPI, which excludes food and energy, rose 2.9%.
• The Federal Reserve kept rates unchanged at 3.50% to 3.75% through the first half of the year. Kevin Warsh was sworn in as Fed Chair in May.
The current economic expansion is now in its seventh year
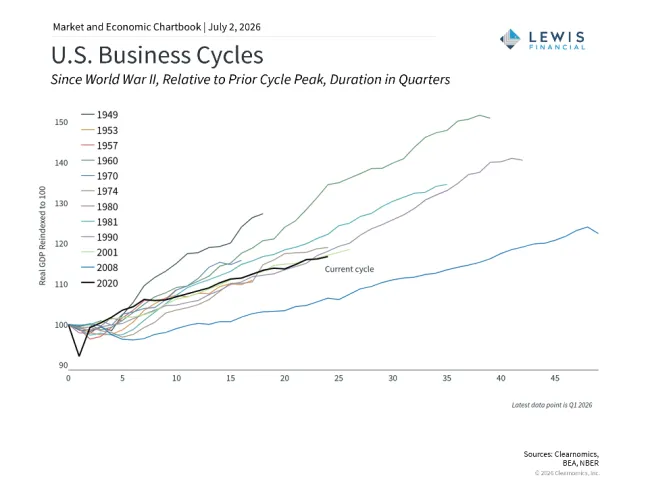
The current business cycle began in April 2020 during the pandemic and recently passed its sixth anniversary. At several points along the way, investors worried a recession was coming, including when inflation peaked in 2022 and when tariffs disrupted trade last year. The economy has proven resilient through all of these challenges. The chart above compares this cycle to other historical periods, including the long expansions that followed the 2008 financial crisis and the 1990s dot-com boom, both of which lasted over a decade.
Today, inflation is elevated but may improve if oil prices stay low. The job market has picked up again, the dollar has stabilized, and business investment has accelerated. Consumers remain cautious but are still spending. On balance, the economy looks healthy, which has historically been a positive sign for financial markets over time.
A wide range of investments has delivered gains in 2026
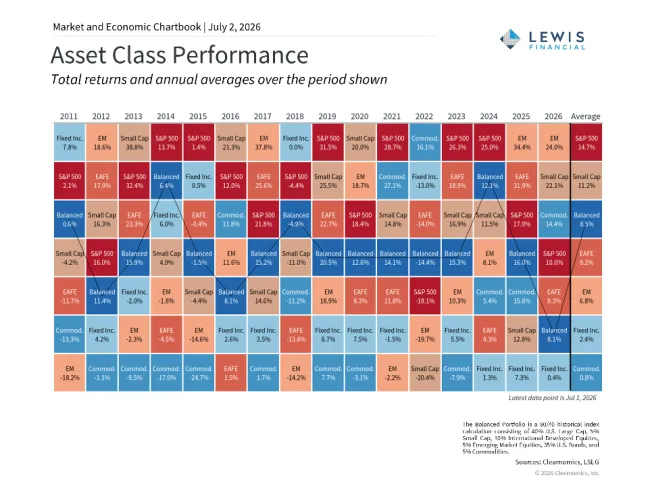
Many different types of investments have contributed to portfolio growth this year. This includes large company stocks, small company stocks, emerging market stocks, and commodities, as shown in the chart above. The second quarter was one of the strongest on record. A key driver was the timing of the war in Iran, which caused a market recovery to begin at the start of April.
Corporate profits have risen over 20% in the past twelve months for S&P 500 companies2, supported by a strong economy, hopes for peace in Iran, and excitement around AI. These gains do mean that U.S. stock valuations, or the price investors pay relative to company earnings, are historically high. The S&P 500 currently trades at a price-to-earnings ratio of 20x, above the long-term historical average of 16x3. While this does not predict short-term market moves, it is a useful guide for building long-term portfolios. This year’s broad gains highlight why maintaining balance across different investment types matters.
Inflation remains elevated, but falling oil prices offer some relief
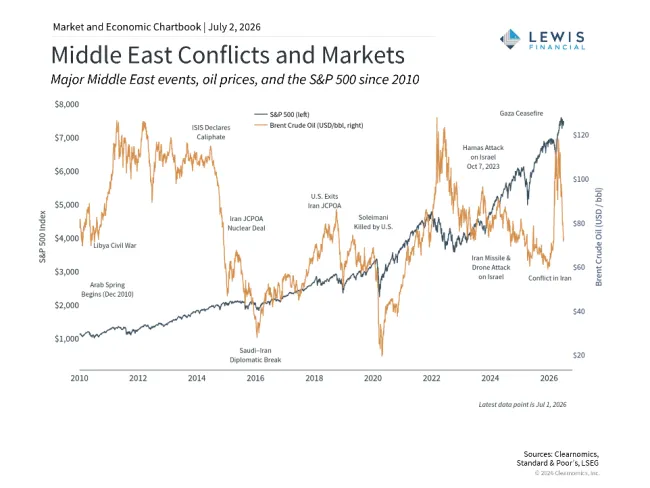
The conflict in Iran disrupted oil shipments and pushed Brent crude oil prices to nearly $120 per barrel before they fell back to around $70, close to pre-conflict levels. Gasoline prices at the pump followed a similar path, peaking above $4.50 per gallon before dropping below $4.00 per gallon4. The Consumer Price Index (CPI), a common measure of inflation, rose 4.2% year-over-year in May, with gasoline prices jumping 40.5%5. Importantly, core CPI, which strips out food and energy, rose only 2.9%, suggesting that inflation has been concentrated in fuel rather than spreading broadly through the economy.
As shown in the chart above, past geopolitical events that affected oil supply, such as Russia’s invasion of Ukraine in 2022, often saw prices stabilize once the situation settled. Many economists hope a similar pattern will play out now, bringing inflation rates back down over time.
Market volatility has remained relatively contained
Market volatility refers to how much stock prices move up and down over short periods. One common way to measure it is the VIX index. The current VIX reading of 16 sits below its long-term average of 18.4 and well below recent peaks, as shown in the chart above. The S&P 500’s largest peak-to-trough decline in 2026 has been 9%. While that kind of drop is never comfortable, the market has fully recovered and has reached 24 new all-time highs so far this year6.
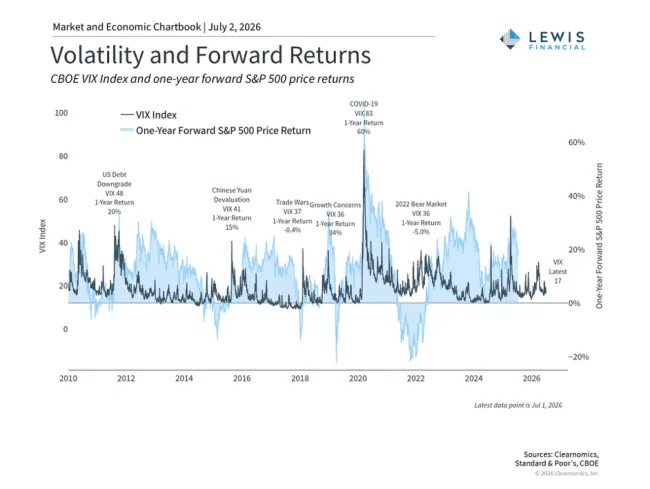
The first half of the year shows that the biggest risk for investors during uncertain times is not the volatility itself, but reacting to it by moving out of the market. Holding a well-balanced portfolio designed to weather different market conditions is a better approach than trying to time the market.
Staying invested matters more than sitting on the sidelines
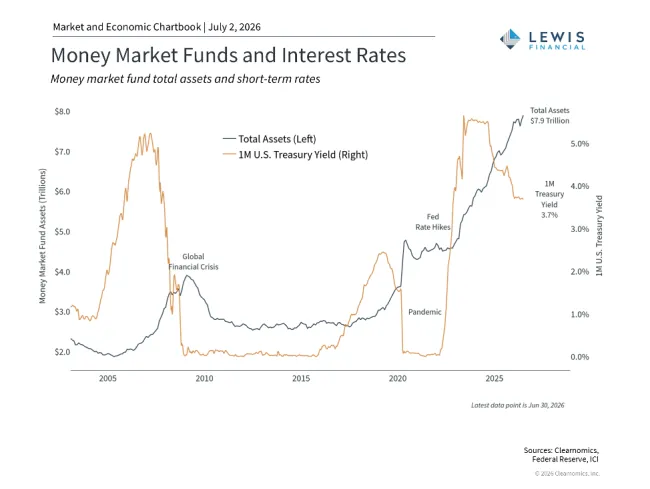
A balanced portfolio that includes investments aimed at growth, income, and protecting capital is a stronger long-term strategy. As the market and economic cycle continues, this approach will only become more important.
The bottom line? The first half of 2026 has rewarded investors who stayed diversified and maintained a long-term perspective, even as geopolitical and economic headlines created short-term uncertainty.
References
1. All figures are as of June 30, 2026 and are on a price return basis unless otherwise noted
2. Clearnomics research and LSEG data as of June 30, 2026
3. Ibid.
4. https://gasprices.aaa.com/
5. https://www.bls.gov/news.release/cpi.nr0.htm
6. Clearnomics research and Standard & Poor’s data as of June 30, 2026
7. Clearnomics research and FDIC data as of June 30, 2026
Index Descriptions
S&P 500
The Standard & Poor’s 500 Index is a capitalization-weighted index of 500 stocks designed to measure performance of the broad domestic economy through changes in the aggregate market value of 500 stocks representing all major industries.
Dow Jones Industrial Average
The Dow Jones Industrial Average consists of 30 stocks that are major factors in their industries and widely held by individuals and institutional investors.
NASDAQ
The NASDAQ Composite Index measures all NASDAQ domestic and non-U.S. based common stocks listed on The NASDAQ Stock Market. The market value, the last sale price multiplied by total shares outstanding, is calculated throughout the trading day, and is related to the total value of the Index.
MSCI Emerging Markets Index
The MSCI EM (Emerging Markets) Index is a free float-adjusted market capitalization weighted index that is designed to measure the equity market performance of the emerging market countries of the Americas, Europe, the Middle East, Africa and Asia. The MSCI EM Index consists of the following emerging market country indices: Brazil, Chile, Colombia, Mexico, Peru, Czech Republic, Egypt, Greece, Hungary, Poland, Qatar, Russia, South Africa, Turkey, United Arab Emirates, China, India, Indonesia, Korea, Malaysia, Philippines, Taiwan, and Thailand.
MSCI EAFE Index
The MSCI EAFE Index is a free float-adjusted market capitalization index that is designed to measure the equity market performance of developed markets, excluding the US & Canada. The MSCI EAFE Index consists of the following developed country indices: Australia, Austria, Belgium, Denmark, Finland, France, Germany, Hong Kong, Ireland, Israel, Italy, Japan, the Netherlands, New Zealand, Norway, Portugal, Singapore, Spain, Sweden, Switzerland and the UK.
Bloomberg US Aggregate Bond Index
The Bloomberg U.S. Aggregate Bond Index is an index of the U.S. investment-grade fixed-rate bond market, including both government and corporate bonds.
Securities and advisory services are offered through LPL Financial, Member FINRA/SIPC.
This material is for general information only and is not intended to provide specific advice or recommendations for any individual. There is no assurance that the views or strategies discussed are suitable for all investors or will yield positive outcomes. Investing involves risks including possible loss of principal. No investment strategy or risk management technique can guarantee return or eliminate risk in all market environments. Any economic forecasts set forth may not develop as predicted and are subject to change.
References to markets, asset classes, and sectors are generally regarding the corresponding market index. Indexes are unmanaged statistical composites and cannot be invested into directly. Index performance is not indicative of the performance of any investment and do not reflect fees, expenses, or sales charges. All performance referenced is historical and is no guarantee of future results.
This information is not intended to be a substitute for specific individualized tax or legal advice. We suggest that you discuss your specific situation with a qualified tax or legal professional.
Bonds are subject to market and interest rate risk if sold prior to maturity. Bond values will decline as interest rates rise and bonds are subject to availability and change in price.
U.S. Treasury securities are guaranteed by the federal government as to the timely payment of principal and interest. The principal value of Treasury securities and other bonds fluctuates with market conditions.
International investments carry additional risks, which include differences in financial reporting standards, currency exchange rates, political risks unique to a specific country, foreign taxes and regulations, and the potential for illiquid markets. These factors may result in greater share price volatility.
This material was prepared by Clearnomics, Inc., who is not affiliated with the named financial professional, firm or broker/dealer.
Copyright (c) 2026 Clearnomics, Inc. All rights reserved. The information contained herein has been obtained from sources believed to be reliable, but is not necessarily complete and its accuracy cannot be guaranteed. No representation or warranty, express or implied, is made as to the fairness, accuracy, completeness, or correctness of the information and opinions contained herein. The views and the other information provided are subject to change without notice. All reports posted on or via www.clearnomics.com or any affiliated websites, applications, or services are issued without regard to the specific investment objectives, financial situation, or particular needs of any specific recipient and are not to be construed as a solicitation or an offer to buy or sell any securities or related financial instruments. Past performance is not necessarily a guide to future results. Company fundamentals and earnings may be mentioned occasionally, but should not be construed as a recommendation to buy, sell, or hold the company's stock. Predictions, forecasts, and estimates for any and all markets should not be construed as recommendations to buy, sell, or hold any security--including mutual funds, futures contracts, and exchange traded funds, or any similar instruments. The text, images, and other materials contained or displayed in this report are proprietary to Clearnomics, Inc. and constitute valuable intellectual property. All unauthorized reproduction or other use of material from Clearnomics, Inc. shall be deemed willful infringement(s) of this copyright and other proprietary and intellectual property rights, including but not limited to, rights of privacy. Clearnomics, Inc. expressly reserves all rights in connection with its intellectual property, including without limitation the right to block the transfer of its products and services and/or to track usage thereof, through electronic tracking technology, and all other lawful means, now known or hereafter devised. Clearnomics, Inc. reserves the right, without further notice, to pursue to the fullest extent allowed by the law any and all criminal and civil remedies for the violation of its rights.