November Market Update: What the Midterm Election, Budget Deficit, and National Debt Mean for Your Portfolio
November Market Update: What the Midterm Election, Budget Deficit, and National Debt Mean for Your Portfolio

With midterm elections underway, many investors are watching closely to see how Congressional control may shift. Forecasts currently point to a divided government as the most likely outcome, given that Republicans hold slim majorities in both the House and Senate.1 While a change in party control would mark a shift from the past two years, divided government is actually quite common, especially during midterm cycles.
One thing is clear regardless of the election outcome: the federal budget deficit, meaning the gap between what the government spends and what it collects in revenue, grew to just under $2 trillion over the past year. That is its highest level in absolute terms since 2021.2 These fiscal challenges are likely to persist no matter which party leads Congress, since rising interest costs and entitlement spending have built up over many decades. The result is a national debt that has now surpassed $40 trillion, or more than 120% of the size of the entire U.S. economy.3
For investors, these headlines can feel unsettling. Keeping a long-term perspective and separating political concerns from investment decisions is key. Here is what investors should know this political season.
The federal budget deficit has grown significantly in recent years
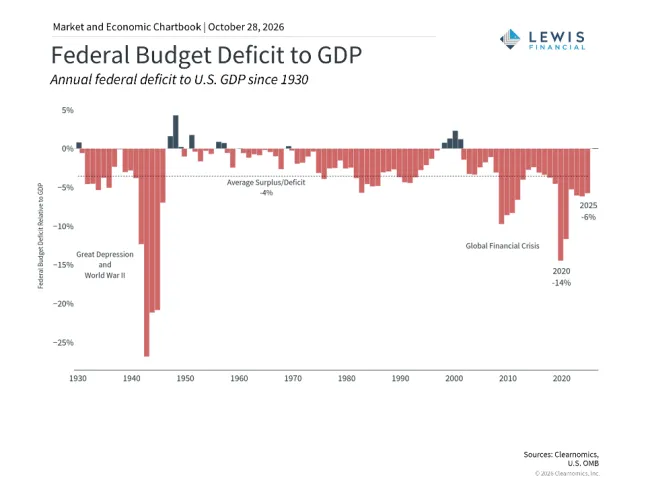
The federal government recorded a $1.99 trillion deficit for the fiscal year ending September 30, 2026, up 12% from $1.78 trillion the prior year.4 In simple terms, the government spent $7.4 trillion but only brought in $5.4 trillion through taxes, tariffs, and other sources.5 To cover the difference, the government borrows money by issuing Treasury securities, which are purchased by investors and institutions around the world.
Based on current economic output, the latest deficit is expected to be around 6% of GDP (Gross Domestic Product, a measure of the total size of the economy), similar to the 2025 ratio.6 Historically, the budget deficit has averaged about 4% of GDP, with larger gaps occurring during major crises such as World War II and the 2008 financial crisis. Over time, these annual deficits add to the national debt, which surpassed $40 trillion for the first time in August. That works out to roughly $117,707 per American, or $298,606 per household, according to the Congressional Joint Economic Committee.7
Government shutdowns have historically had a limited impact on the stock market
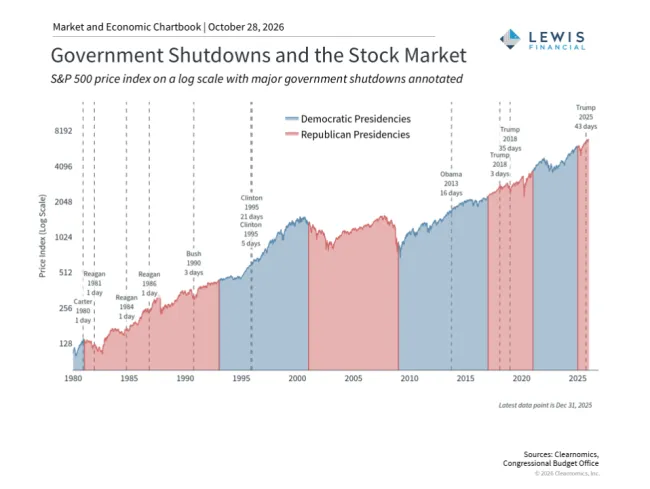
There are two near-term issues worth watching. First, the national debt is approaching the statutory debt ceiling of $41.1 trillion set by the One Big Beautiful Bill Act last year, which could be reached by mid-2027.8 The federal government also faces a budget deadline of December 11, shortly after the midterm election. Raising the debt ceiling will likely be a central debate for the next Congress, and if an agreement is not reached in time, a government shutdown could occur.
While shutdowns can create hardship for federal workers and cause short-term market swings, major stock market indexes have historically stabilized quickly, even during long shutdowns such as those in 2018 and 2025. The chart above illustrates this pattern. Second, rising interest rates are adding to the government's fiscal pressure. The 30-year Treasury yield has remained above 5% since June, meaning that as older government debt matures, it must be replaced with new borrowing at higher rates. This increases the government's interest payments and widens the budget gap. The Treasury Department has intervened by purchasing Treasury securities to help keep U.S. interest rates stable.9
Policy uncertainty tends to create short-term market swings, not lasting downturns
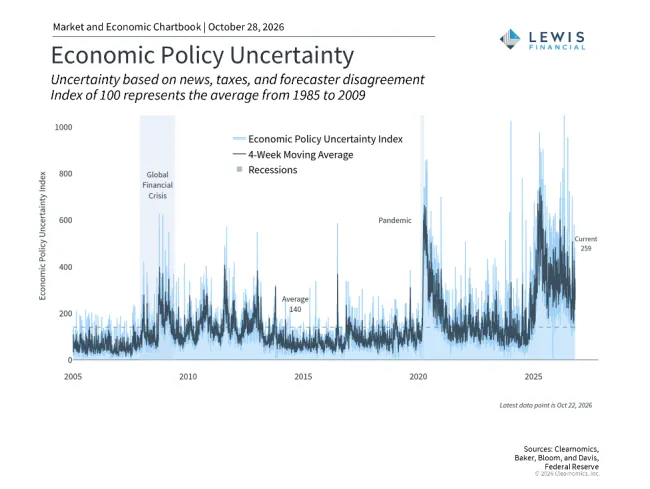
The national debt is a long-term challenge with no easy fixes, since any solution involves difficult decisions around taxes, spending, and entitlement programs. At the same time, policy predictions have often proven inaccurate. For example, the market decline following last year's tariff announcements was shorter than many anticipated, and markets went on to reach new all-time highs.
As the chart above shows, uncertainty around economic policy has contributed to short-term market swings in recent years, but these periods have typically been brief. What tends to matter more over the long run are underlying factors such as corporate earnings, interest rates, and broader economic trends. For investors, focusing on these fundamentals rather than reacting to political headlines is generally a more sound approach.
The bottom line? The midterm election and the growing federal deficit are important topics, but history shows that long-term portfolio outcomes are driven by fundamentals rather than by political outcomes.
References
1. https://www.realclearpolling.com/latest-polls
2. https://fiscaldata.treasury.gov/americas-finance-guide/national-deficit/
3. https://fiscaldata.treasury.gov/americas-finance-guide/national-debt/
4. https://fiscaldata.treasury.gov/americas-finance-guide/national-debt/
5. https://www.realclearpolling.com/latest-polls
6. Clearnomics research using U.S. Treasury and Bureau of Economic Analysis data, as of October 23, 2026
7. https://www.jec.senate.gov/public/index.cfm/republicans/debt-dashboard
8. Clearnomics research and U.S. Treasury data, as of October 23, 2026
9. https://home.treasury.gov/news/press-releases/sb0607
Index Descriptions
S&P 500
The Standard & Poor's 500 Index is a capitalization-weighted index of 500 stocks designed to measure performance of the broad domestic economy through changes in the aggregate market value of 500 stocks representing all major industries.
Securities and advisory services are offered through LPL Financial, Member FINRA/SIPC.
This material is for general information only and is not intended to provide specific advice or recommendations for any individual. There is no assurance that the views or strategies discussed are suitable for all investors or will yield positive outcomes. Investing involves risks including possible loss of principal. No investment strategy or risk management technique can guarantee return or eliminate risk in all market environments Any economic forecasts set forth may not develop as predicted and are subject to change.
References to markets, asset classes, and sectors are generally regarding the corresponding market index. Indexes are unmanaged statistical composites and cannot be invested into directly. Index performance is not indicative of the performance of any investment and do not reflect fees, expenses, or sales charges. All performance referenced is historical and is no guarantee of future results.
This information is not intended to be a substitute for specific individualized tax or legal advice. We suggest that you discuss your specific situation with a qualified tax or legal professional.
Bonds are subject to market and interest rate risk if sold prior to maturity. Bond values will decline as interest rates rise and bonds are subject to availability and change in price.
U.S. Treasury securities are guaranteed by the federal government as to the timely payment of principal and interest. The principal value of Treasury securities and other bonds fluctuates with market conditions.
International investments carry additional risks, which include differences in financial reporting standards, currency exchange rates, political risks unique to a specific country, foreign taxes and regulations, and the potential for illiquid markets. These factors may result in greater share price volatility.
This material was prepared by Clearnomics, Inc., who is not affiliated with the named financial professional, firm or broker/dealer.
Copyright (c) 2026 Clearnomics, Inc. All rights reserved. The information contained herein has been obtained from sources believed to be reliable, but is not necessarily complete and its accuracy cannot be guaranteed. No representation or warranty, express or implied, is made as to the fairness, accuracy, completeness, or correctness of the information and opinions contained herein. The views and the other information provided are subject to change without notice. All reports posted on or via www.clearnomics.com or any affiliated websites, applications, or services are issued without regard to the specific investment objectives, financial situation, or particular needs of any specific recipient and are not to be construed as a solicitation or an offer to buy or sell any securities or related financial instruments. Past performance is not necessarily a guide to future results. Company fundamentals and earnings may be mentioned occasionally, but should not be construed as a recommendation to buy, sell, or hold the company's stock. Predictions, forecasts, and estimates for any and all markets should not be construed as recommendations to buy, sell, or hold any security--including mutual funds, futures contracts, and exchange traded funds, or any similar instruments. The text, images, and other materials contained or displayed in this report are proprietary to Clearnomics, Inc. and constitute valuable intellectual property. All unauthorized reproduction or other use of material from Clearnomics, Inc. shall be deemed willful infringement(s) of this copyright and other proprietary and intellectual property rights, including but not limited to, rights of privacy. Clearnomics, Inc. expressly reserves all rights in connection with its intellectual property, including without limitation the right to block the transfer of its products and services and/or to track usage thereof, through electronic tracking technology, and all other lawful means, now known or hereafter devised. Clearnomics, Inc. reserves the right, without further notice, to pursue to the fullest extent allowed by the law any and all criminal and civil remedies for the violation of its rights.